

Florence Nightingale is most famous for her role as a nurse. During the Crimean war, which raged in Turkey between 1853 and 1856, she worked at the military hospitals where British troops were treated. She became known as the "lady with the lamp", who made her rounds at night to look after injured soldiers. After the war, Florence Nightingale pushed through a reform of military hospitals, which until then had been dirty and disorganised. It was a major achievement: women in Victorian Britain were not expected to do this sort of work, and Nightingale had to fight hard to be taken seriously by the authorities.
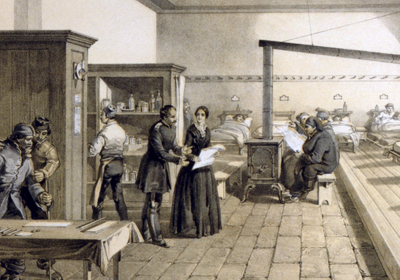
Nightingale at the Scutari hospital, in a picture taken in 1856.
Although Florence Nightingale is famous as a nurse, you might not know that the main tool she used in her campaign to reform hospitals was statistics. Statistics is an area of mathematics in which numbers that describe the real world are collected and then analysed to see what we can learn from them. Nightingale had been shocked by the conditions she'd found in the military hospitals in Turkey: there were no blankets, beds, furniture, food, or cooking utensils, and there were rats and fleas everywhere. Nightingale was unhappy about the appalling lack of cleanliness and hygiene, but also about the fact that no one had properly organised the medical records. Even the number of deaths was not accurate; hundreds of men had been buried, but their deaths were not recorded.
Nightingale carefully recorded statistics such as numbers and causes of deaths, and found that the unsanitary conditions, which could lead to diseases such as cholera and typhoid, killed more soldiers than actual war-wounds. Her conclusion was shocking: "our soldiers are enlisted to die in barracks", she wrote.
After the war Nightingale set about persuading people that a hospital reform was necessary, using her statistics and the help of the statistician William Farr. It can be hard to get people to look at and understand long lists of numbers — and this is where one of Nightingale's brightest ideas came in. Like other statisticians at the time, Nightingale realised that the best way to get across statistical information is to use pictures. She invented what are called polar area graphs — you can see an example below.
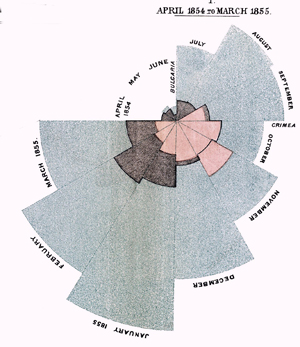
Nightingale's most famous polar area diagram: Diagram of the causes of mortality [i.e. death] in the army in the east.
The diagram is cut into twelve equal angles, with each slice representing one month of the year. Each colour represents a cause of death and the area of each coloured wedge, measured from the centre, is in proportion to the number of soldiers that died from that cause — so the larger the wedge, the more soldiers died. The blue outer wedges represent the deaths from contagious diseases, such as cholera and typhus. The central red wedges show the deaths from wounds. The black wedges in between represent deaths from all other causes.
Since the blue wedges are so much larger than the others, one glance at the diagram shows that diseases were the greatest killers. If this rate had continued, and troops had not been replaced frequently, then disease alone would have killed the entire British Army in the Crimea. Nightingale's graph showed just how many soldiers died needlessly during the Crimean War, and was used as a tool to persuade the government and medical profession that deaths could be prevented with better sanitation in military, and also in civilian, hospitals.
Nightingale's knack with statistics not only brought about hospital reforms, but also led to other mathematicians honouring her for her contribution to the subject. In 1858 William Farr nominated her as the first woman to be elected a Fellow of the Statistical Society of London. In the same year she was elected to the Statistical Congress, and she was made an honorary foreign member of the American Statistical Association in 1874. She published a total of 200 books, reports and pamphlets during her lifetime.
And her legacy continues today. Open any newspaper and you will find lots of graphs, pie charts, histograms or other visual methods used to bring across statistical information. Today the medical profession relies on statistics more than ever: without careful records and analyses of experiments it's impossible to tell what makes people sick and how to cure them.
About this article
This article is based on The compassionate statistician by Eileen Magnello, which first appeared on Plus magazine (and is slightly more advanced).